Smart greenhouse
A final-year project connecting greenhouse sensors, a local display and cloud-based tomato disease identification.
Final-year team project · JKUAT · May 2025
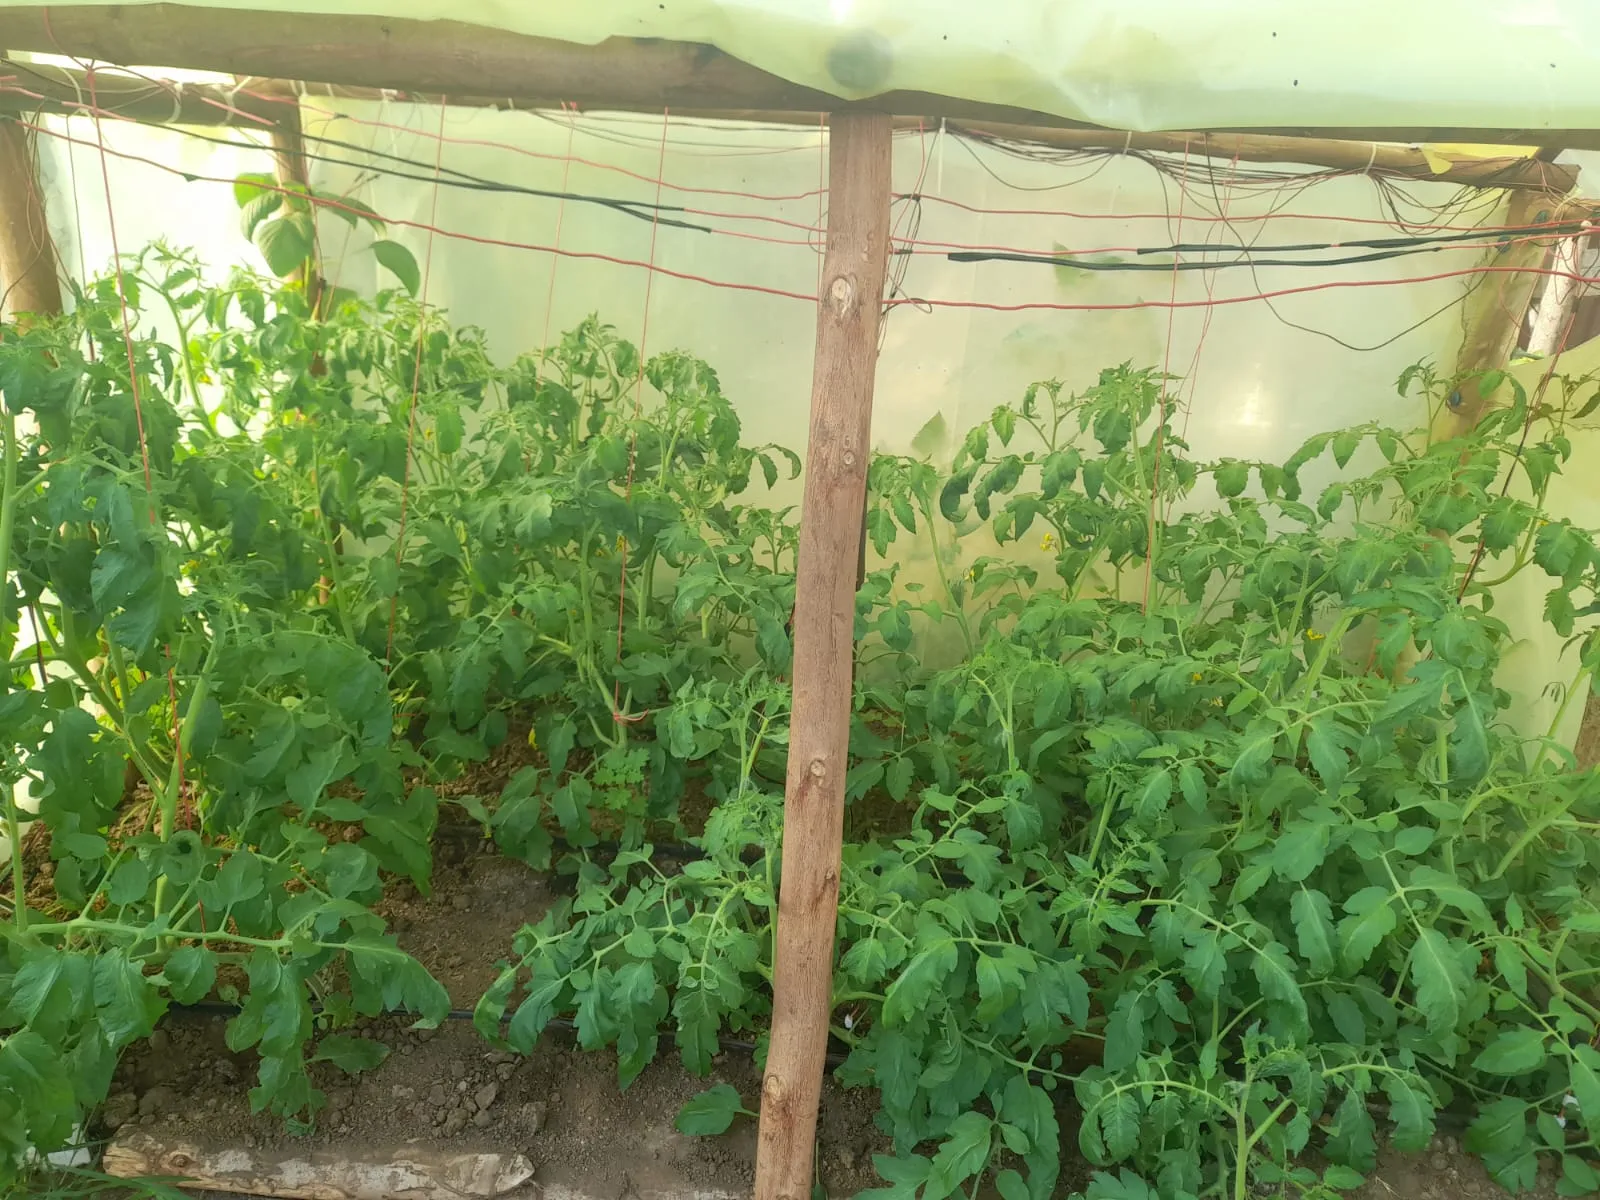
The problem
The project looked at two jobs on a tomato farm: keeping track of growing conditions and checking plants for disease. We built a greenhouse prototype that brought sensor readings, camera images and farm information into one system. It was our final-year project at JKUAT, completed in May 2025.
The greenhouse and sensor network
The hardware combined an STM32 Discovery board, an ESP32 camera and sensors for conditions including soil moisture, temperature and humidity. The ESP32 and STM32 communicated over UART, a serial connection between the boards.
Sensor readings were processed and buffered before being sent through an internet gateway to cloud storage. We had planned to use fusion filters to smooth the readings, but these proved difficult to implement. The prototype used a simple moving average instead.
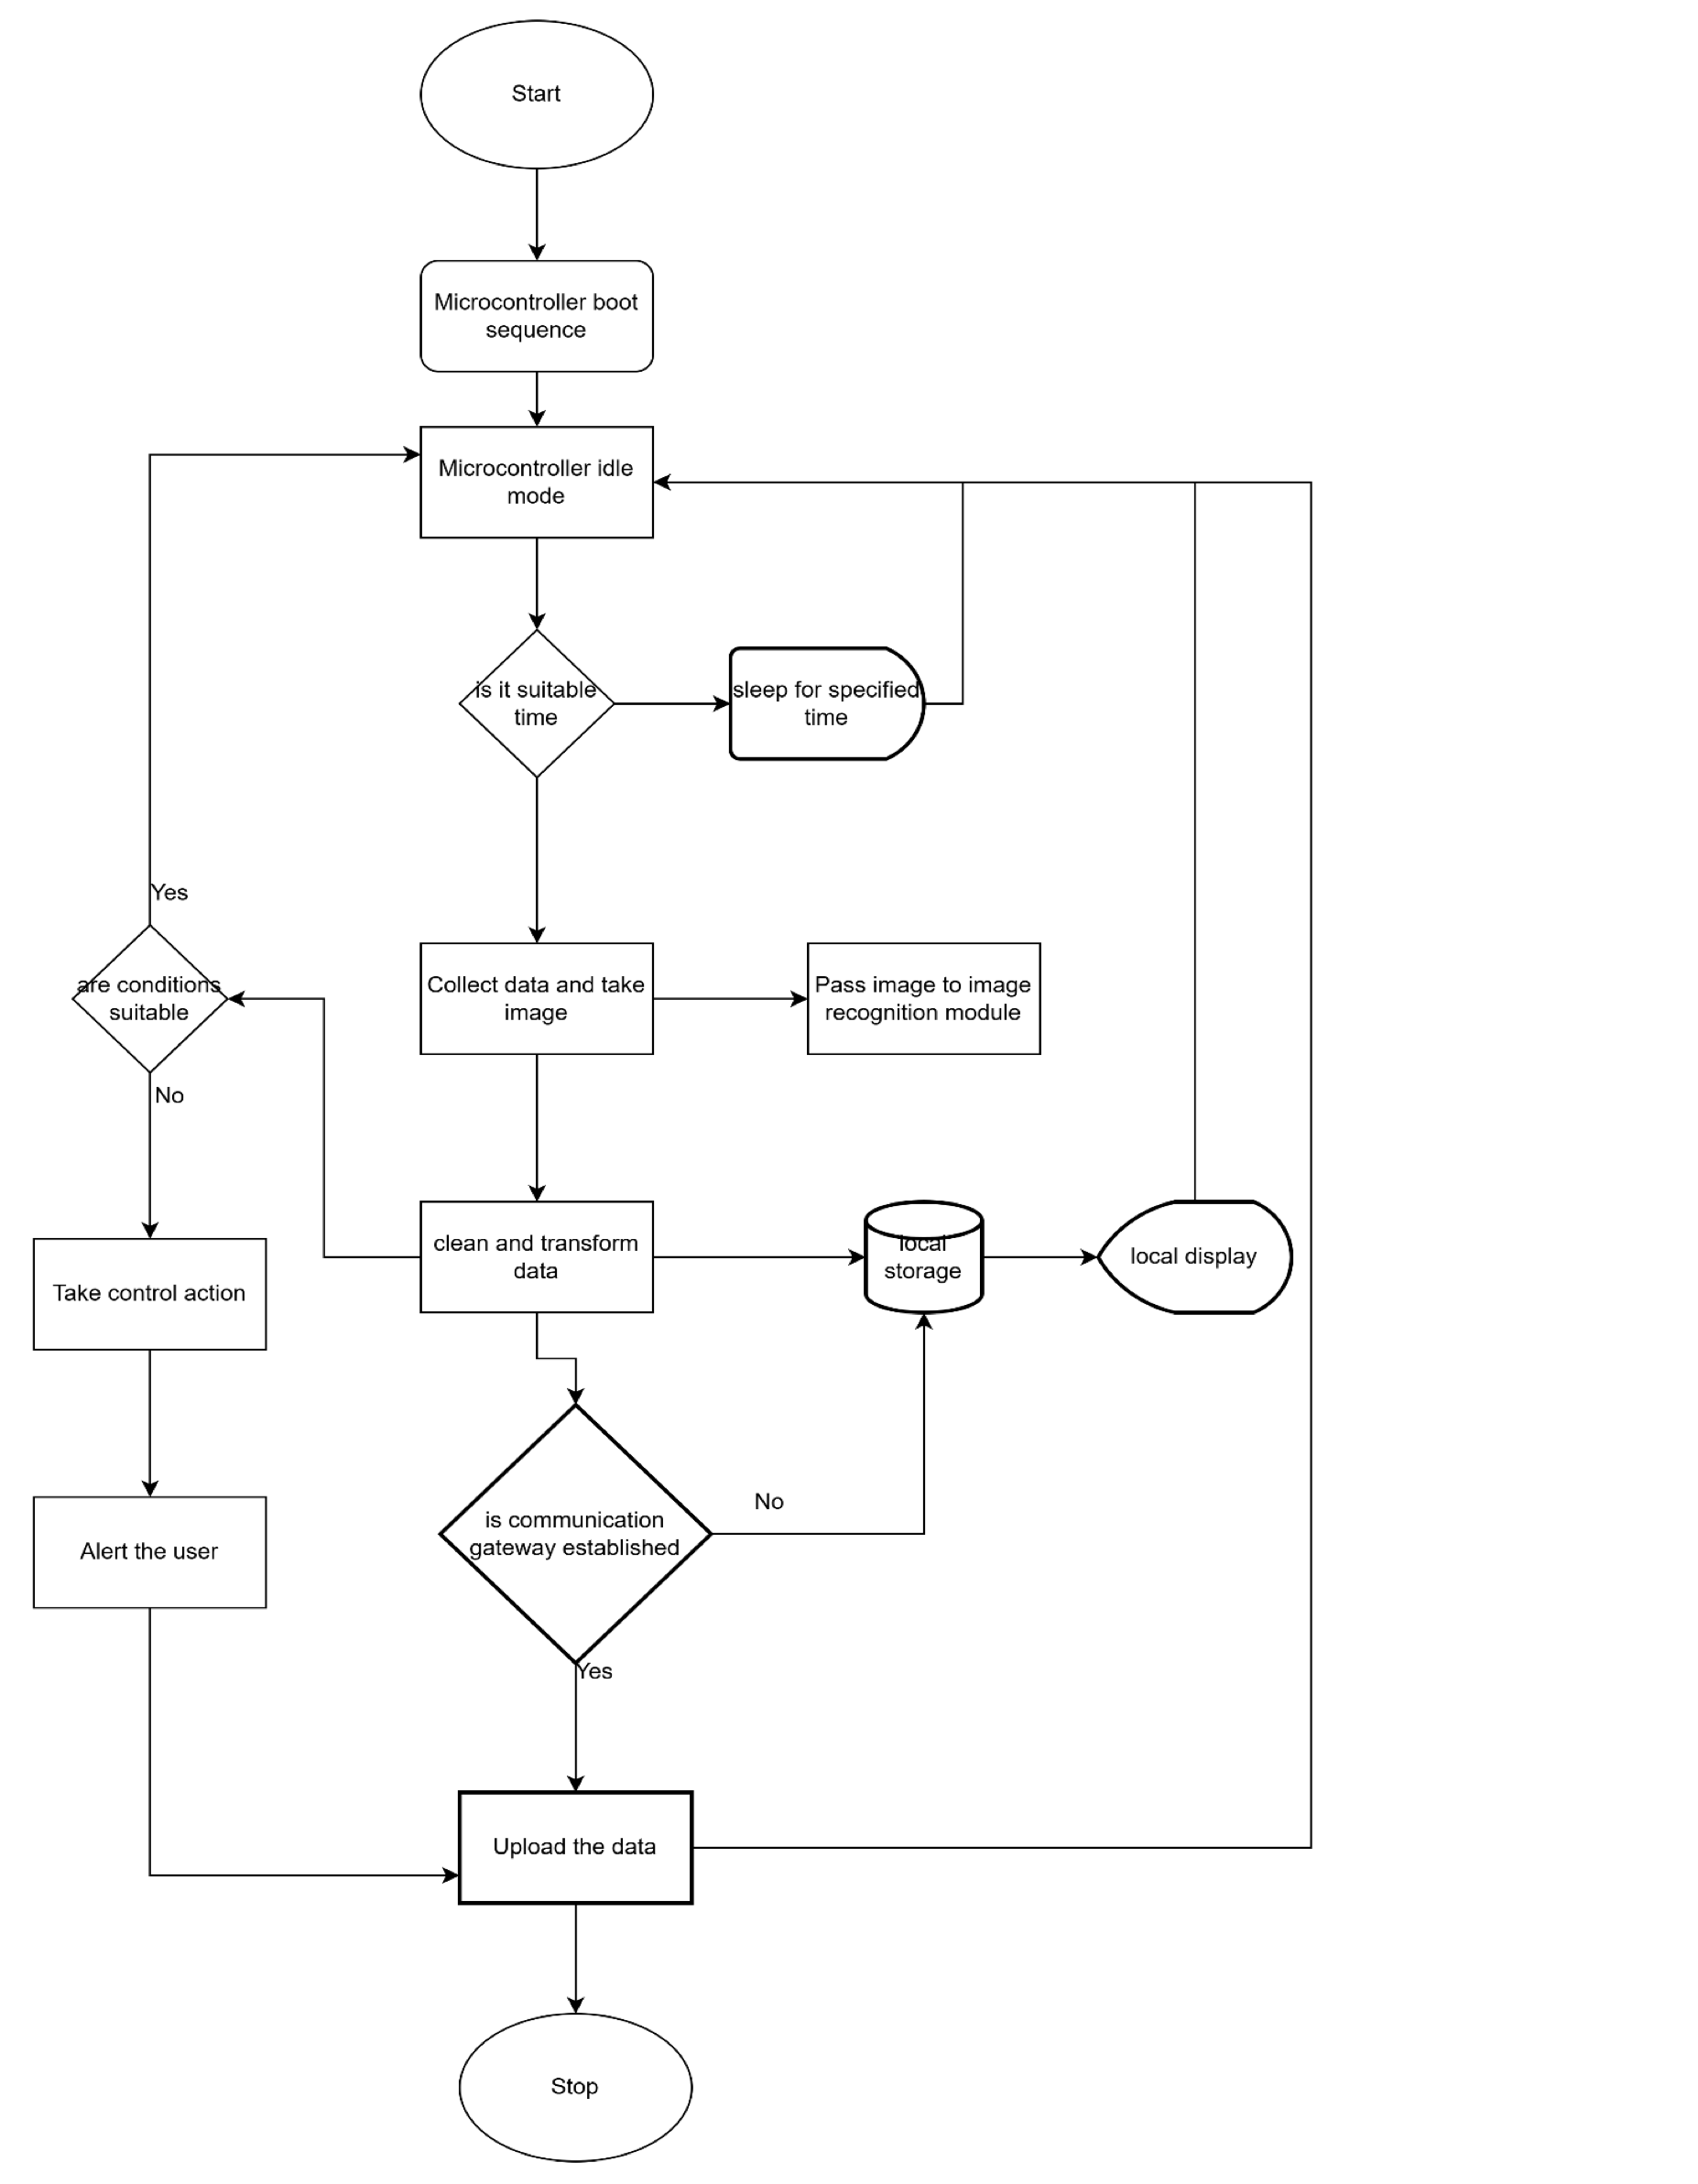
Readings appeared on the STM32’s display as well as a dashboard accessible through an Android application. The local display gave the farmer a way to check conditions when the cloud connection was unavailable. The controller also ran control routines for the greenhouse’s actuators.
Identifying disease from leaf images
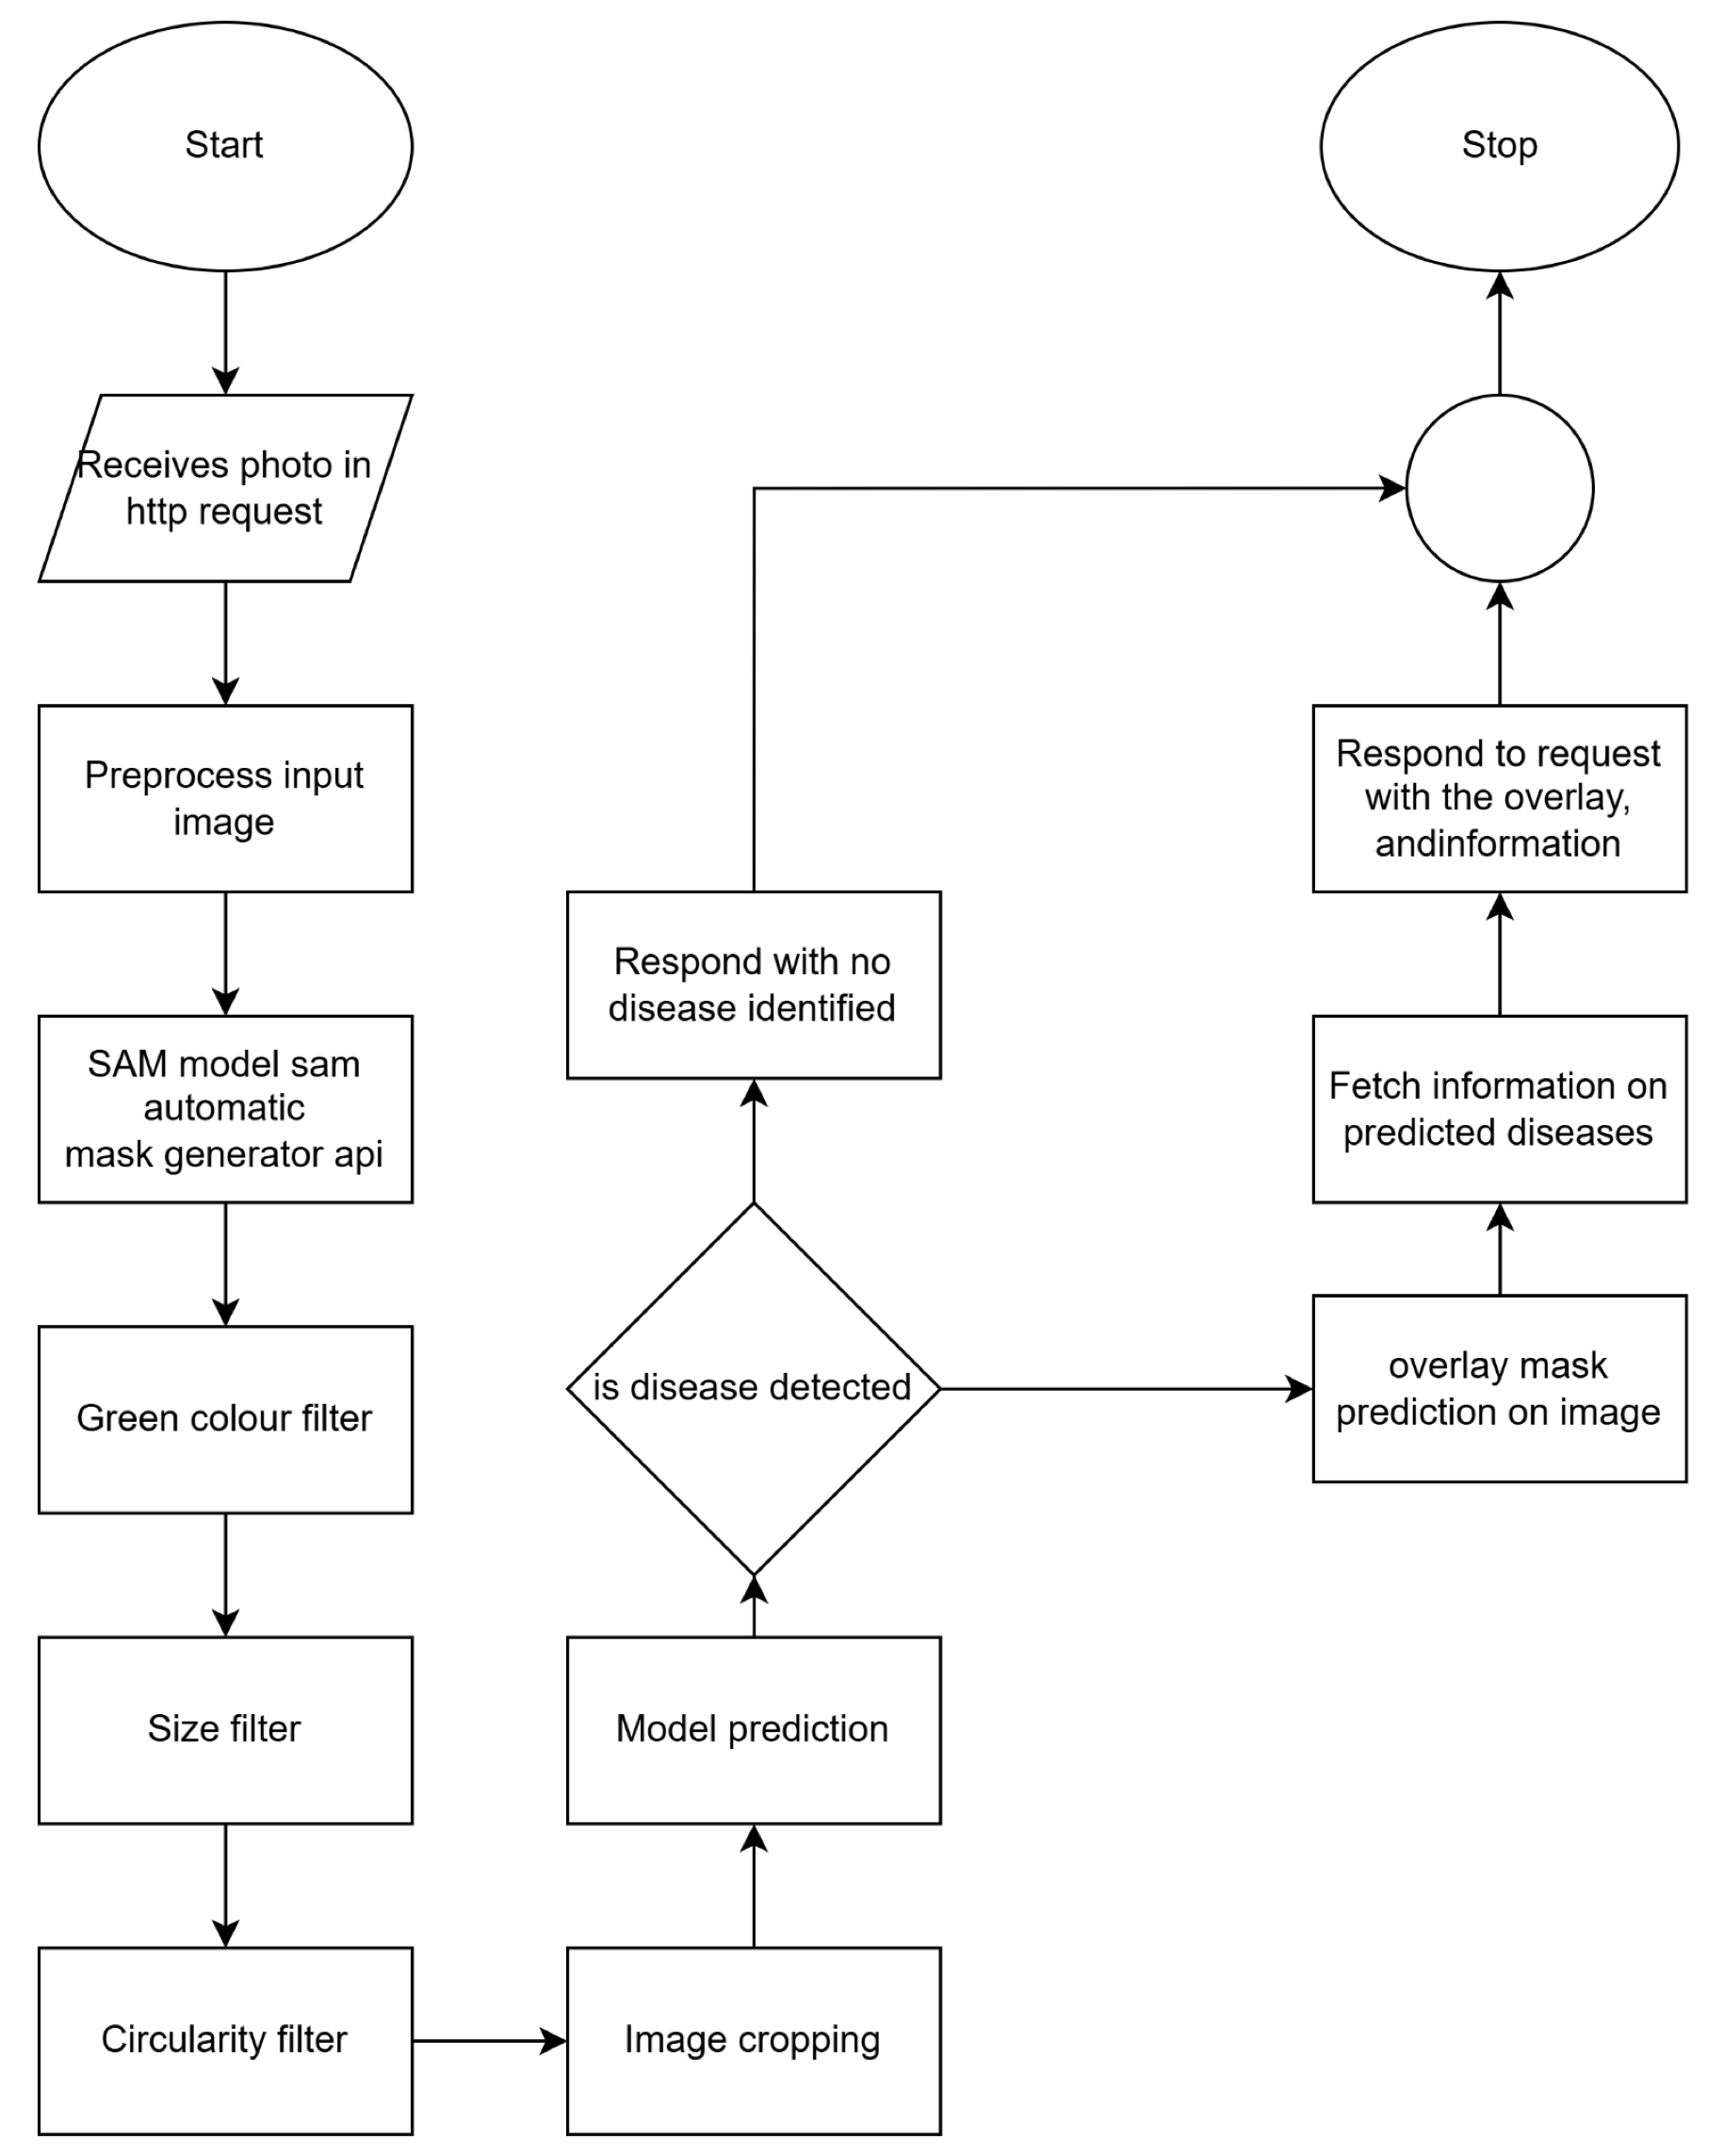
The camera supplied images of the tomato plants. The image-processing pipeline used the Segment Anything Model (SAM) to produce masks around objects in a picture. Filters based on colour, size and shape selected likely leaves, which were then cropped for classification.
A convolutional neural network, built with TensorFlow, classified the leaf images. Training data included the PlantVillage dataset, with healthy tomato leaves and examples of nine disease or pest classes. Image preparation included resizing, rescaling and augmentation.
The models ran on cloud servers. A Flask service received images, processed them and returned predictions and image overlays to the client. The microcontroller handled the greenhouse’s sensor and control work.
Accessing the information
The team built the mobile application with React Native and TypeScript. It displayed farm readings and provided an interface for asking questions about the farm.
The wider system combined speech recognition, translation, information retrieval and text-to-speech. It was designed to support interactions in English, Kikuyu and Kiswahili, so farmers could use spoken questions as well as text. The report describes these services alongside the sensor dashboard and disease-identification work.
Testing power and irrigation
Energy management was tested in MATLAB simulations. These covered power flow, battery charge and the order in which loads should be disconnected when power was low. The battery simulation still lost charge and entered load shedding, so this part needed further work.
Irrigation logic was tested with generated soil-moisture data. In the dry-soil case, it requested irrigation and activated the valve state. In the wet-soil case, it left the valve closed. These were simulation results; they did not measure water savings in the greenhouse.
My contribution
I built the IoT network and contributed to parts of the ML pipeline. The greenhouse, application, language features and energy-management work formed a team project.
What remained to be done
The report recommended a better camera, shorter connections between sensors and controllers, and WebSocket support for streaming updates back to embedded devices.
The work produced a physical greenhouse and a prototype data and image-processing system. The report does not provide field-trial results establishing classification accuracy, crop-yield gains or water savings. Its disease-identification section mixes prototype outputs with expected outcomes.
About this summary
This page summarises Smart Farm Solutions Using Precision Agriculture, the May 2025 project report. It draws on the hardware and software methodology, the results chapter and the final recommendations.
Report diagrams
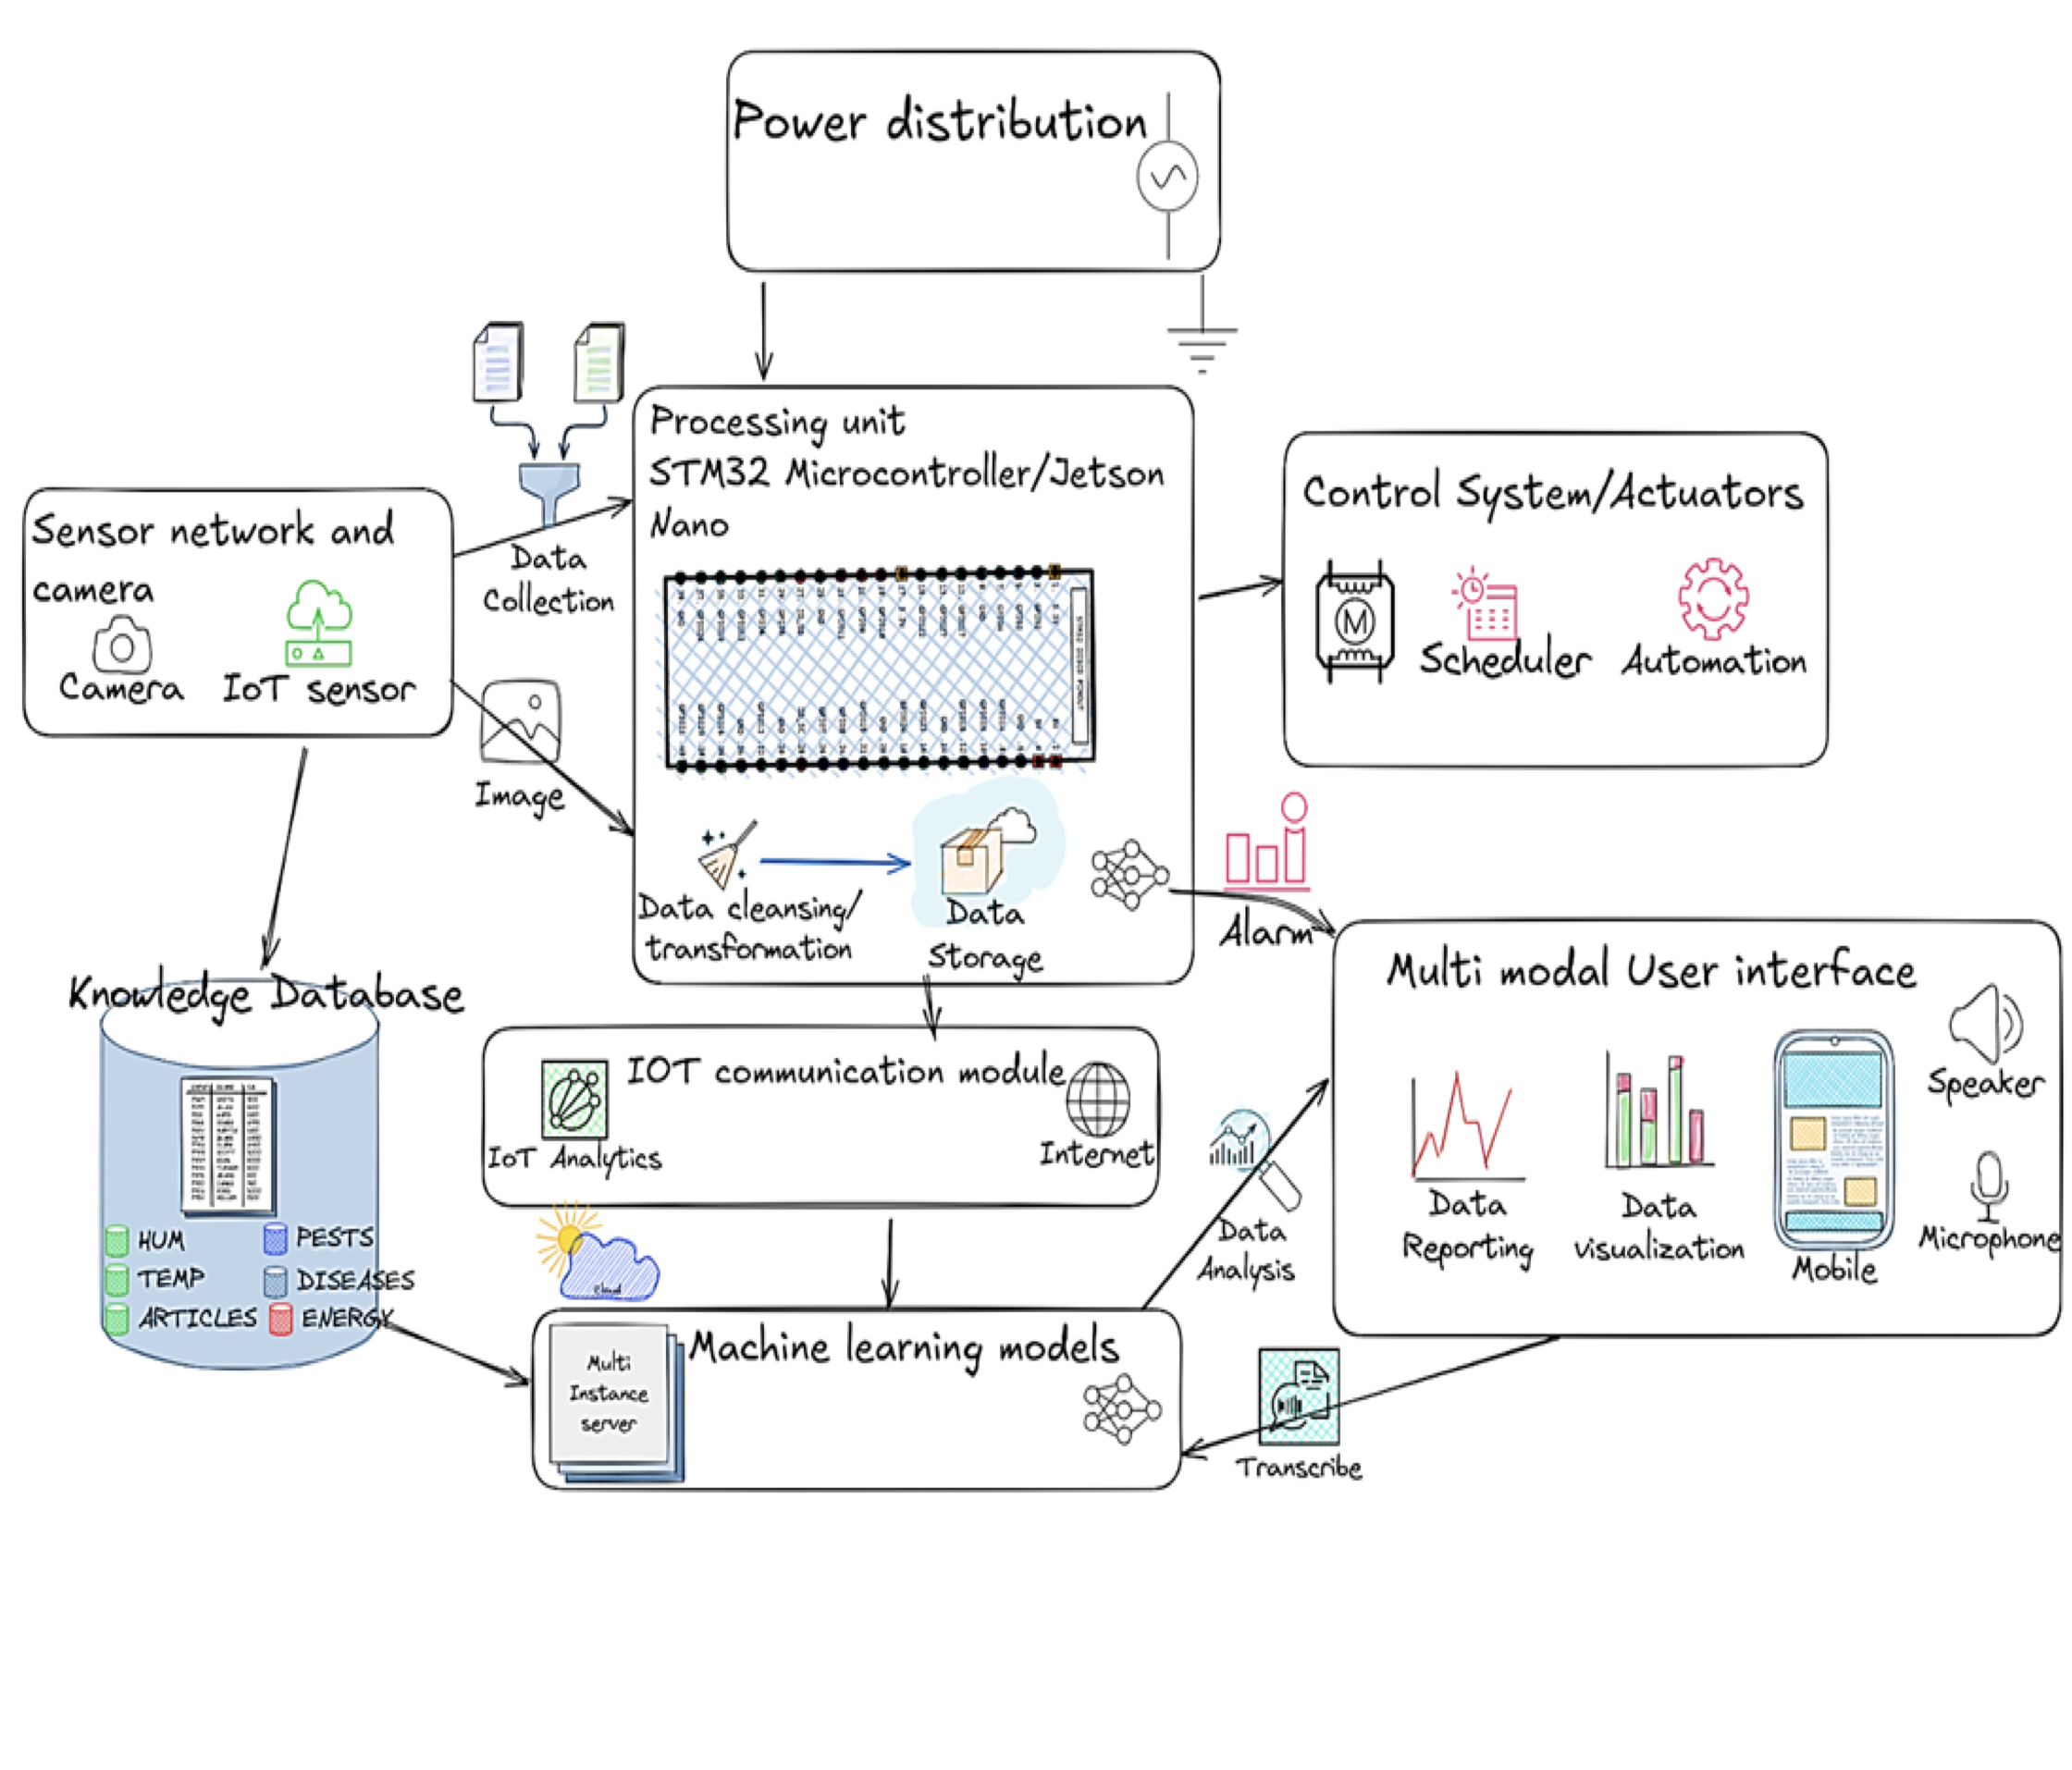
System block diagram
The report’s block diagram connects sensing, processing, actuators, the IoT network and the user interface. Open any diagram at full size to inspect the flow.
IoT and sensor network
The monitoring loop collects and cleans sensor readings, takes control actions, and keeps a local display. Data uploads when the communication gateway is available.
Disease identification
An image arrives over HTTP. SAM generates masks; colour, size and circularity filters select leaf crops for the classifier. The response returns predictions and an image overlay.